
Canadian Weather
We're sorry, the page you have tried to access is no longer available. We've recently increased the number of locations we offer weather information for and as a result have updated our URL structure. We understand this can be inconvenient, however we are here to help you find the information you need.
Choose how to continue:
Based on your previous bookmark, here is a list of the closest locations:
- Fort Nelson (0 m N)
- Northern Rockies Regional Municipality (600 m W)
- Snake River (29.6 km NE)
- Steamboat (60.4 km W)
- Prophet River (79.1 km S)
Find information based on your location.
Search by province/territoryBrowse through a list of provinces and territories to find a location.
This hour's hot and cold spots ...
Hot spot in Canada: 18.9 °C66.0 °F Hope Airport, BC
Cold spot in Canada: -30.4 °C-22.7 °F Eureka Airport, NU
Find your location
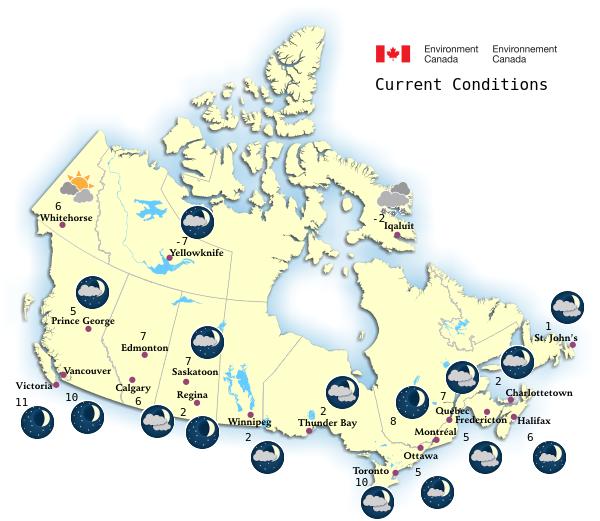
Current Conditions
| City | Condition | Temperature |
|---|---|---|
| Calgary | Cloudy | -2°C |
| Charlottetown | Cloudy | -2°C |
| Edmonton | 0°C | |
| Fredericton | Light Snow | -2°C |
| Halifax | Light Snow | -1°C |
| Iqaluit | Partly Cloudy | -19°C |
| Montréal | Light Rain | 1°C |
| Ottawa | Light Freezing Rain | 0°C |
| Prince George | Sunny | 10°C |
| Québec | Light Freezing Rain | -1°C |
| Regina | Partly Cloudy | -4°C |
| Saskatoon | Partly Cloudy | -6°C |
| St. John's | Mainly Clear | 0°C |
| Thunder Bay (Thunder Bay) | Mostly Cloudy | 0°C |
| Toronto | Light Rain and Fog | 3°C |
| Vancouver | Mostly Cloudy | 10°C |
| Victoria | Mostly Cloudy | 13°C |
| Whitehorse | Mostly Cloudy | 3°C |
| Winnipeg | Mostly Cloudy | -1°C |
| Yellowknife | Mostly Cloudy | -13°C |
- Date modified: